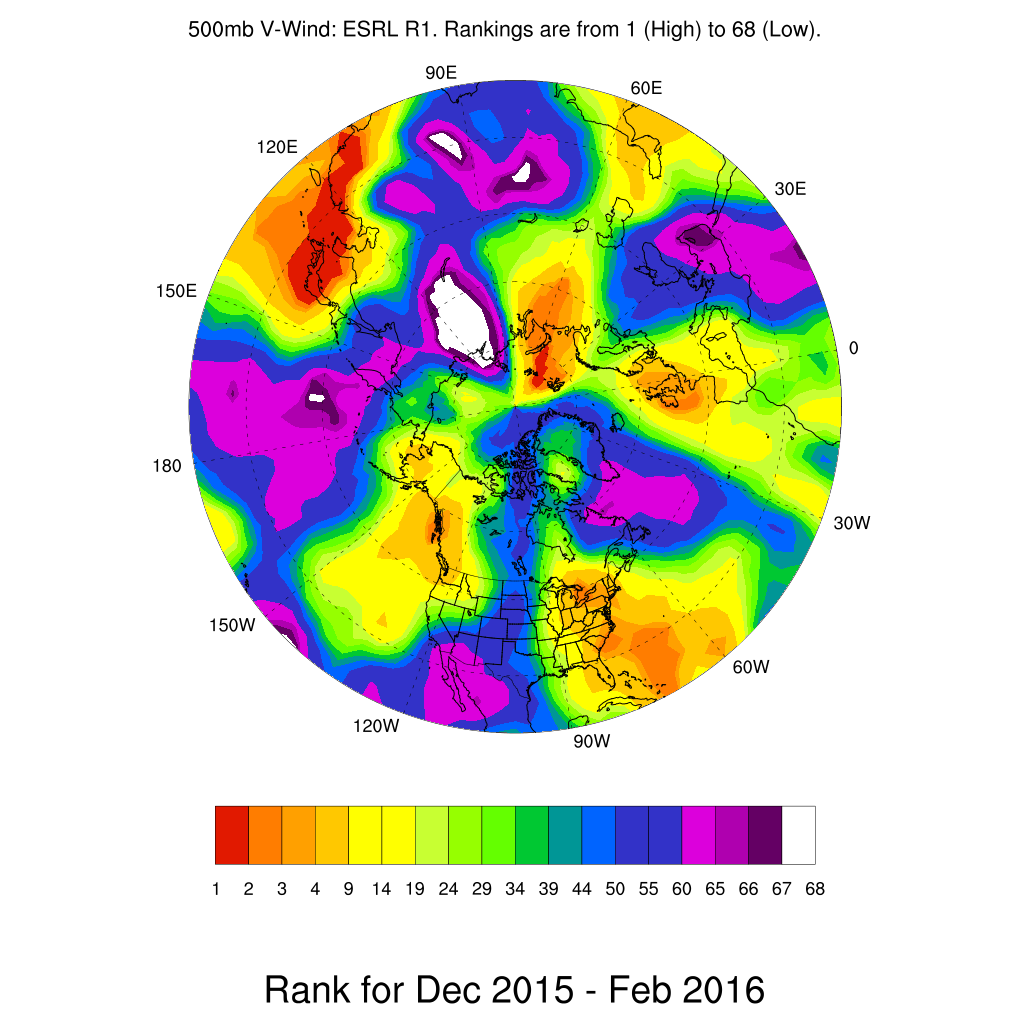
Here are some new reanalysis (R1) rankings for the December 2015 - February 2016 (DJF) climatological winter. The values in the maps below compare the this most recent DJF period with every previous DJF period going back to the winter of 1948-1949. Whenever you see a dark red color, it represents the highest value on record (68 years). A white color represents the lowest value on record. Here are the maps. A companion blog post with global perspective maps is found
HERE.


Brian if there was a way to eliminate the warming factor what would these maps look like - that is say same period of time two hundred years earlier?
ReplyDeleteThe program I use to make these, NCL, has a "detrend" function that outputs the difference between the measured value and the long-term trend line. If I have a chance, I'll run it next week. Thanks for the comment!
DeleteBrian if there was a way to eliminate the warming factor what would these maps look like - that is say same period of time two hundred years earlier?
ReplyDelete