Season Definitions
Surprisingly, very little research has been done on using climatological data to fine tune the definition of the seasons at the local scale. When I looked a few years ago, I only found a single paper in the peer-review literature that specifically looked at reshuffling the dates where the seasons begin (citation pending). This effort only attempted to assess whether the 90-92 days seasons actually line up with the calendar months. They showed that it was actually not that far off.
More recently, Boustead et al. (2015) used an elaborate rubric to define the winter season using temperature, snowfall, and snow depth – the AWSSI. Their definition of winter was expansive and made sure to capture the maximum length of wintry condition. In March/April, a measurable snowfall extended the winter season until (at least) the day of the snow – and longer if it stayed on the ground. However, an argument can be made that multiple days in the 60°s/70°s during March that are followed by a quick snowfall does not mean those days in the 60°s/70°s are part of winter. The AWSSI bins them in the winter season. This is not a flaw of the AWSSI; as the AWSSI's goal is to capture all winter conditions.
The Data
I used the Global Historical Climatology Network version 4 (GHCNv4) database of monthly climate temperatures for all analysis. Here comes an important point. Climate normals are based on monthly temperatures. This seems counter intuitive. Why not use daily data if we have it? The answer is that daily data are chaotic. In addition, many stations collect data at irregular schedules that make daily estimates difficult but are good at the monthly level.
Up through the 1971-2010 climate period, the National Center for Environmental Information (NCEI), formerly the National Climate Data Center (NCDC), used a cubic spline fit of monthly average temperature to interpolate daily climate normals. In the 1981-2010 climate period, they modified the procedure somewhat using a methodology that is explained in some detail but in a way that is not replicatable.
For my analysis, I used 1981-2010 monthly temperature data and applied the cubic spline technique that NCEI used in prior climate normal periods. The daily values produced are not very different than the non-replicatable NCEI published values. With that caveat ...
Adjusting Cold 90-Days and Warm 92-Days
The December 1 to February 28 time period is 90 days long (I am ignoring Leap Days). Is this really the coldest 90 days of the year? Correspondingly, the June 1 to August 31 time period is 92 days long. Is this really the warmest 92 days of the year?
These are questions that have long interested me. To answer the question, I generated daily normal temperatures for every U.S./Canada station in the GHCN v4 data set (7,636 stations). For each of those station, I flagged the coldest 90 days of the year and the warmest 92 days of the year. The seasons are therefore redefined as:
1) Winter: coldest 90 days
2) Summer: warmest 92 days
3) Spring: days between winter and summer (undetermined length)
4) Fall: days between summer and winter (undetermined length)
The length of winter and summer are fixed and the combined length of spring and fall are fixed – but the length of spring and fall as individual seasons vary from place to place.
Figures 1-4 below show the dates of winter and fall, and the lengths of spring and fall using the aforementioned methodology. Figure 5 shows a sample of stations with the start and end dates of all seasons using a color-coded index.
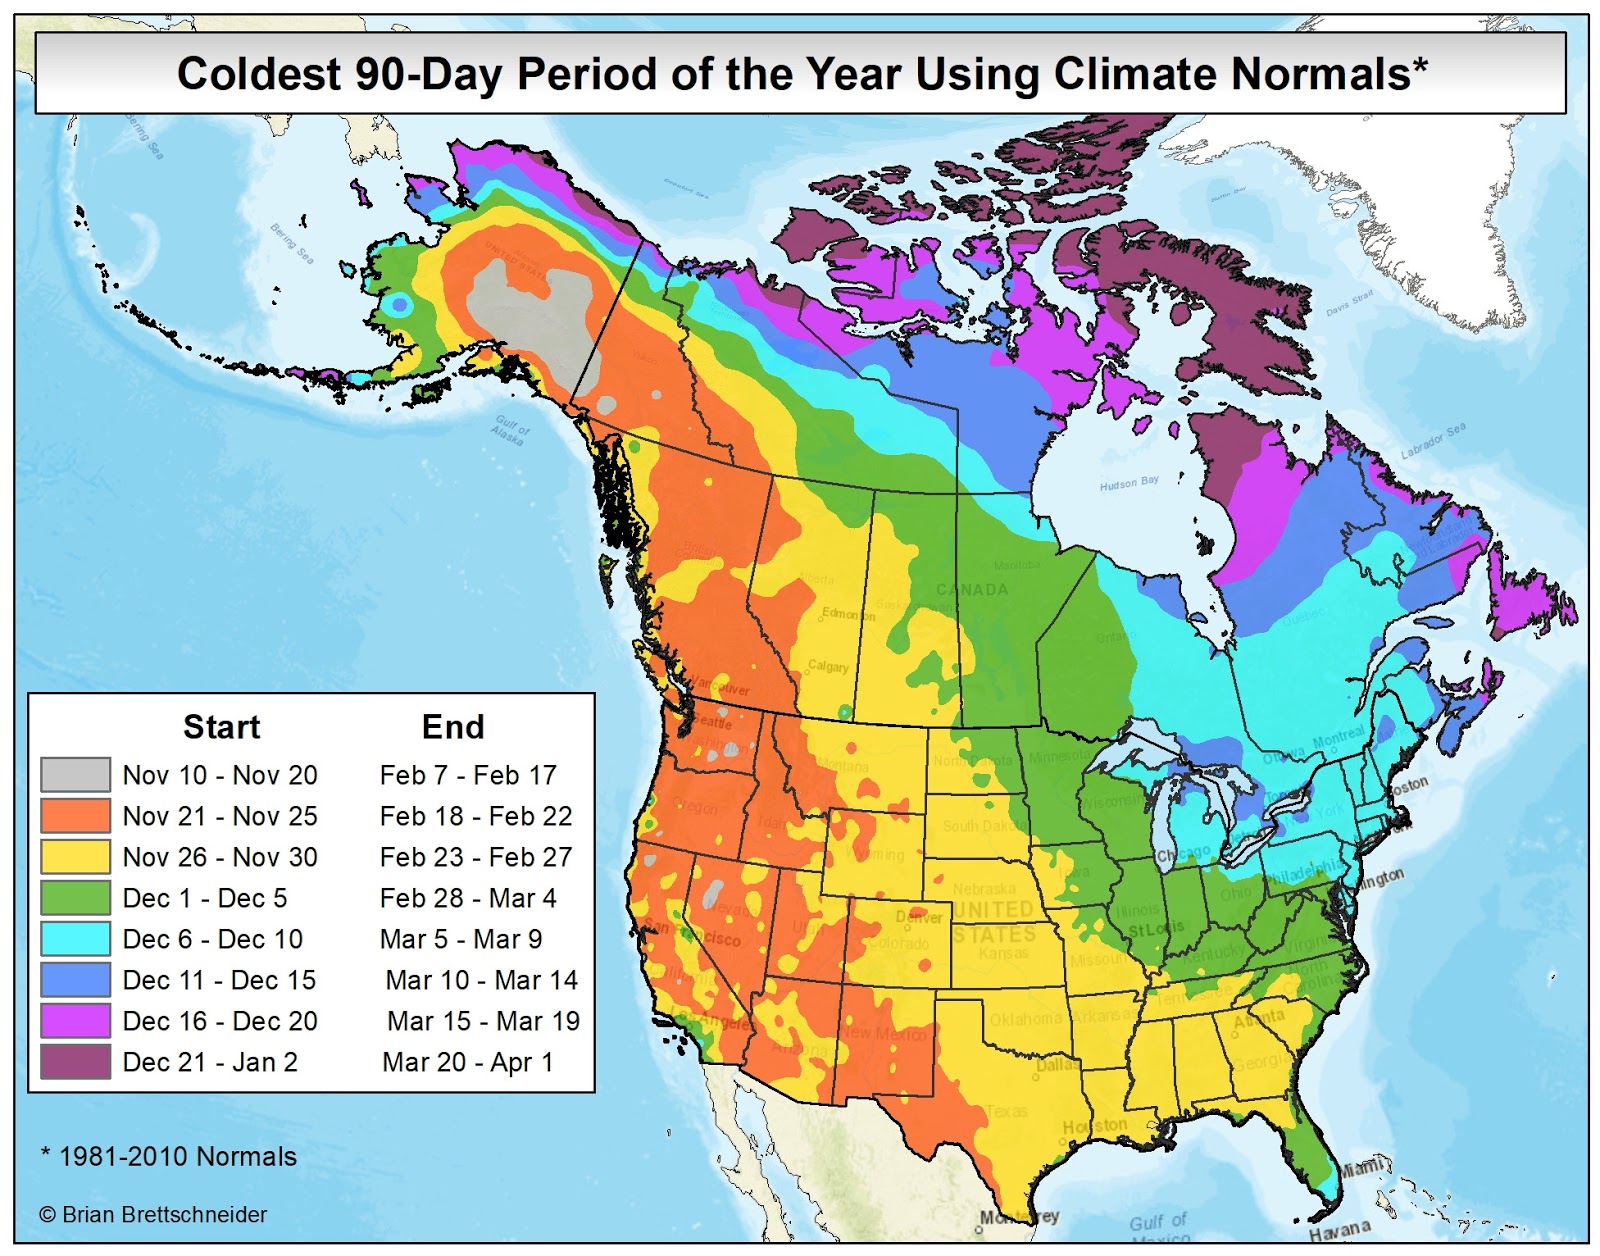
Figure 1. Coldest 90-day period of he year during 1981-2010 using climate normals generated from the GHCN v4 data set.

Figure 2. Warmest 92-day period of he year during 1981-2010 using climate normals generated from the GHCN v4 data set.
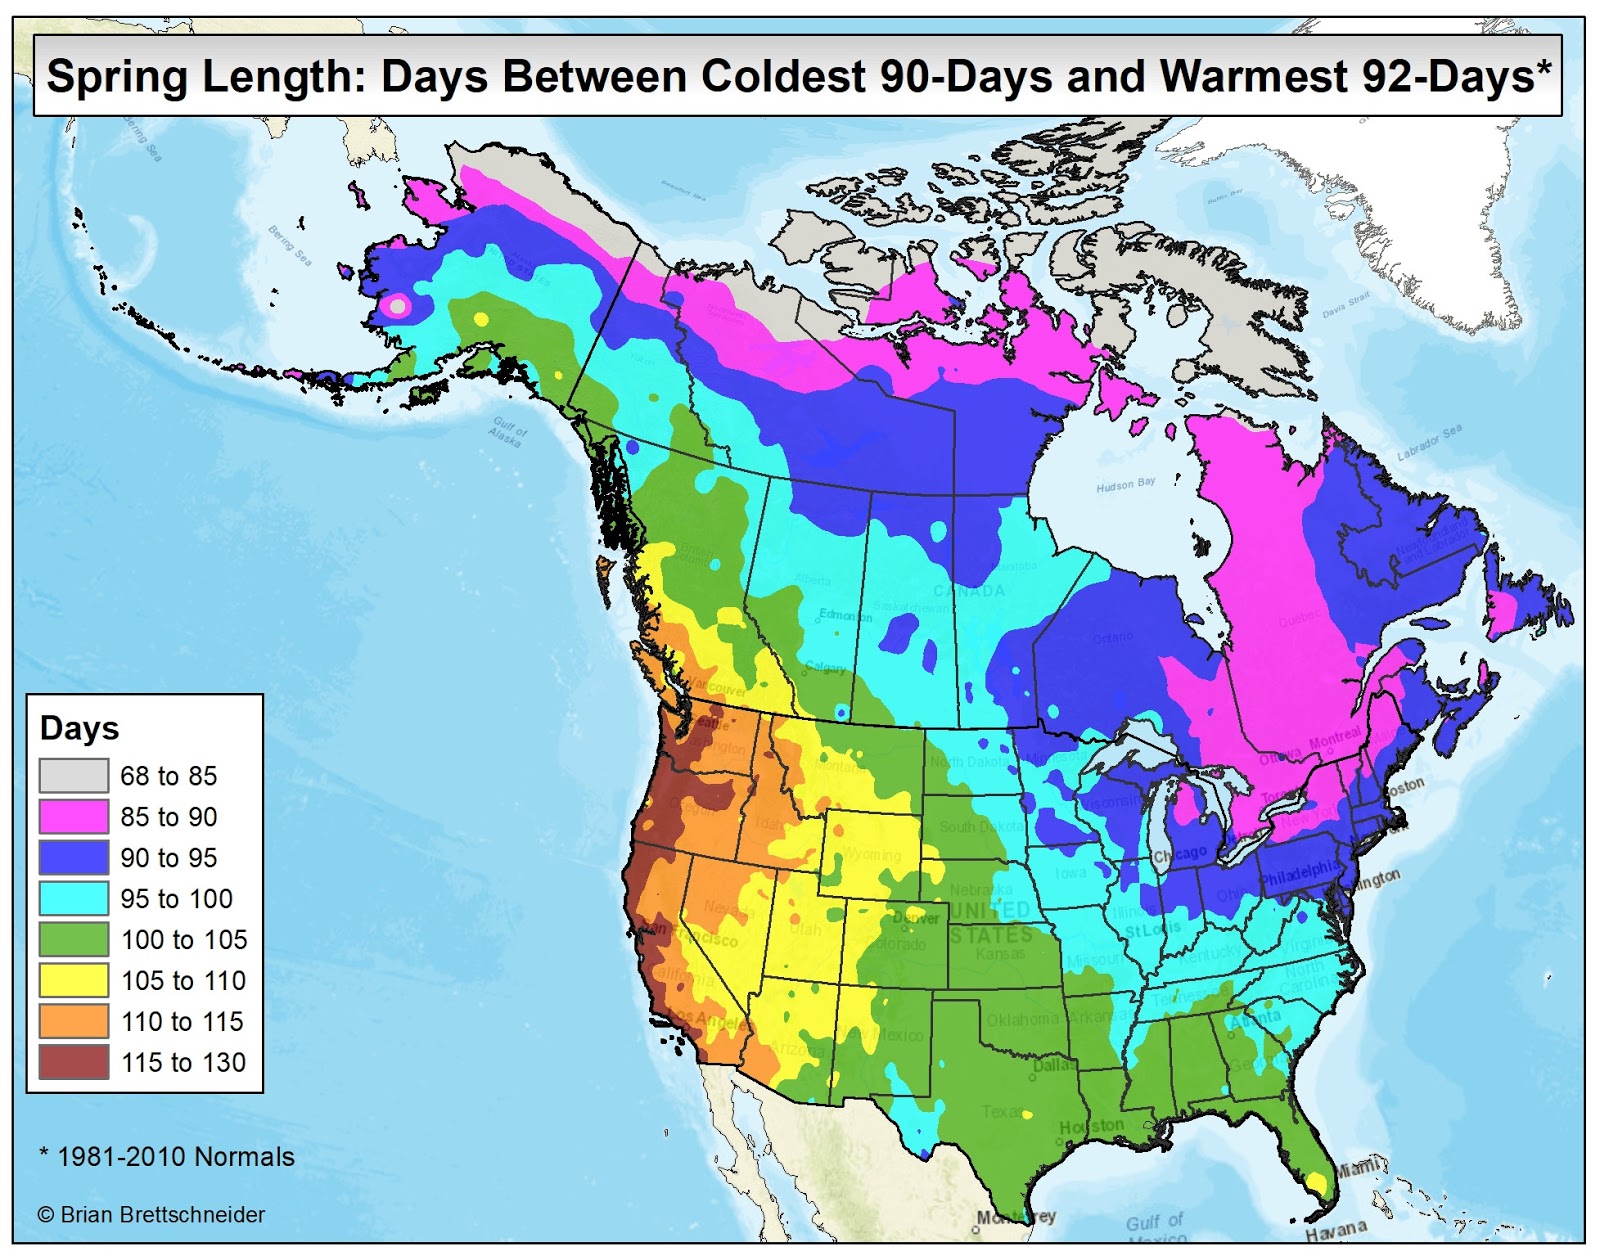
Figure 3. The number of days between the coldest 90-day period and the warmest 92-day period. This is the length of spring.
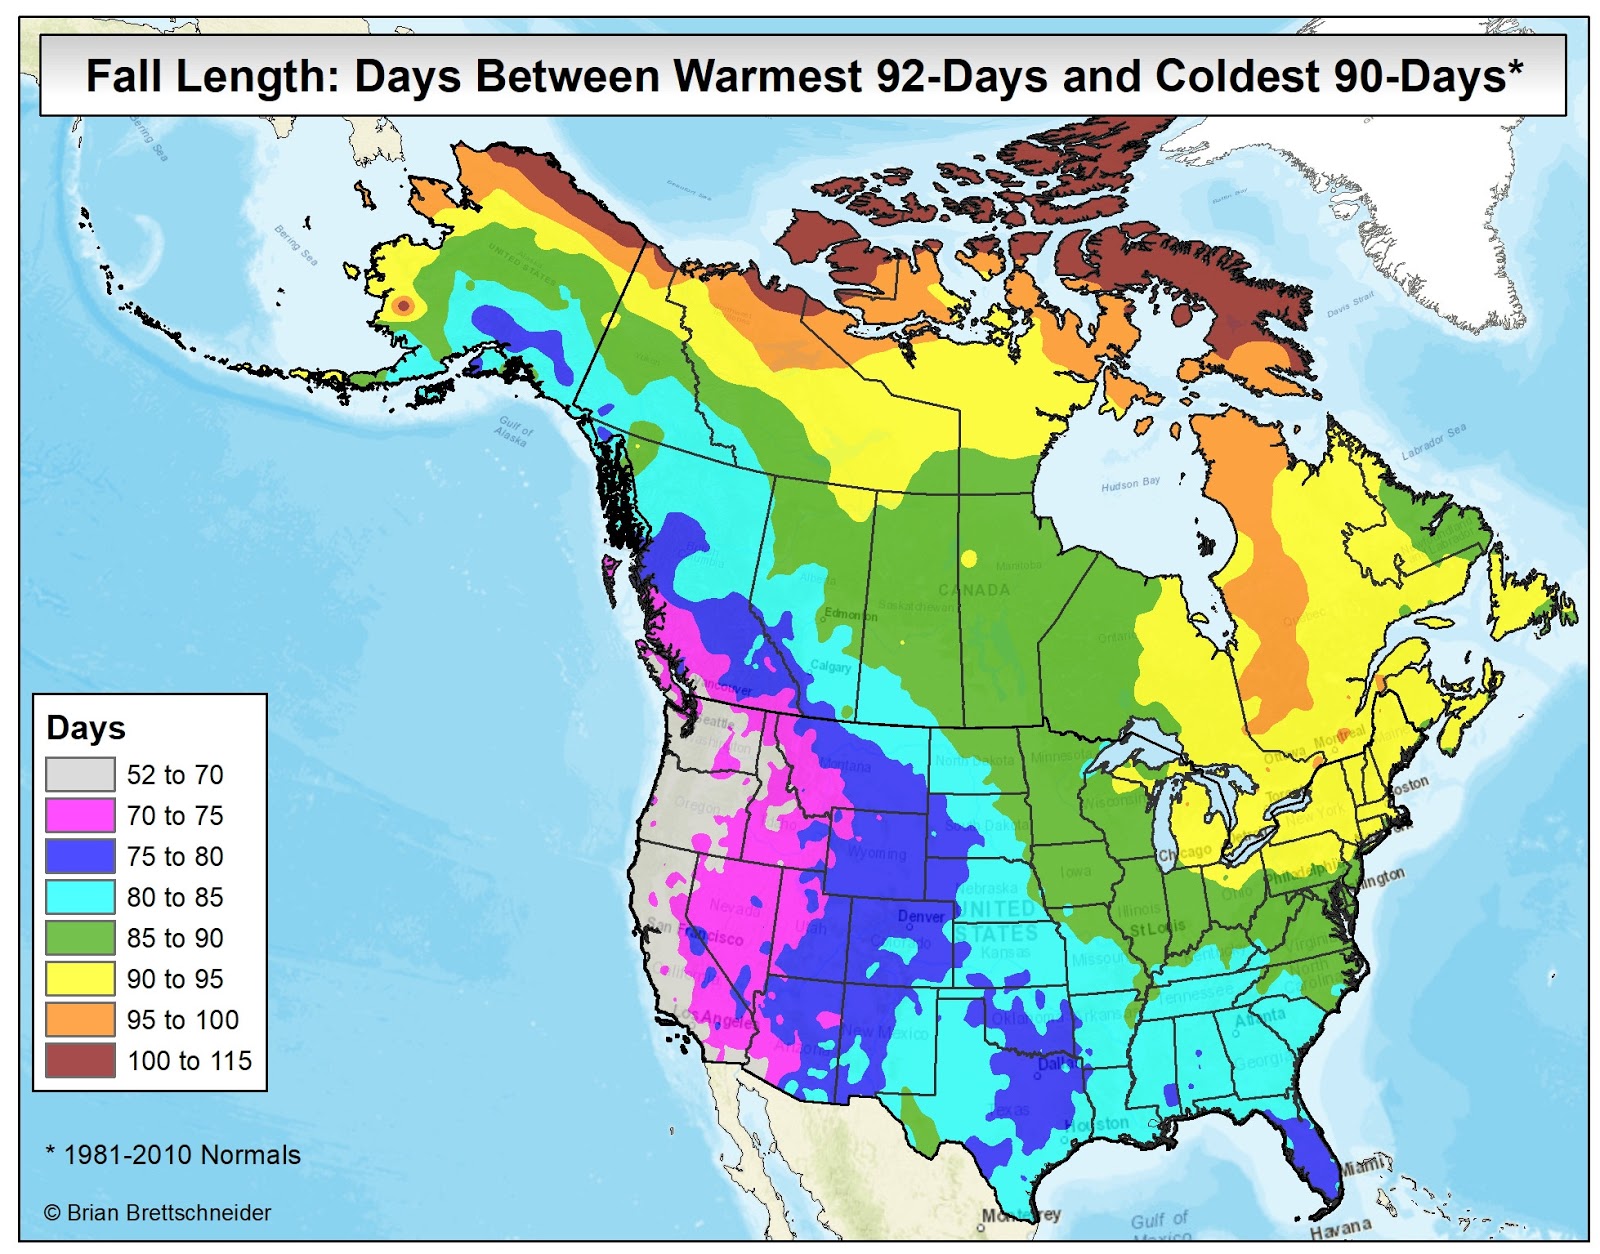
Figure 4. The number of days between the warmest 92-day period and the coldest 90-day period . This is the length of fall.
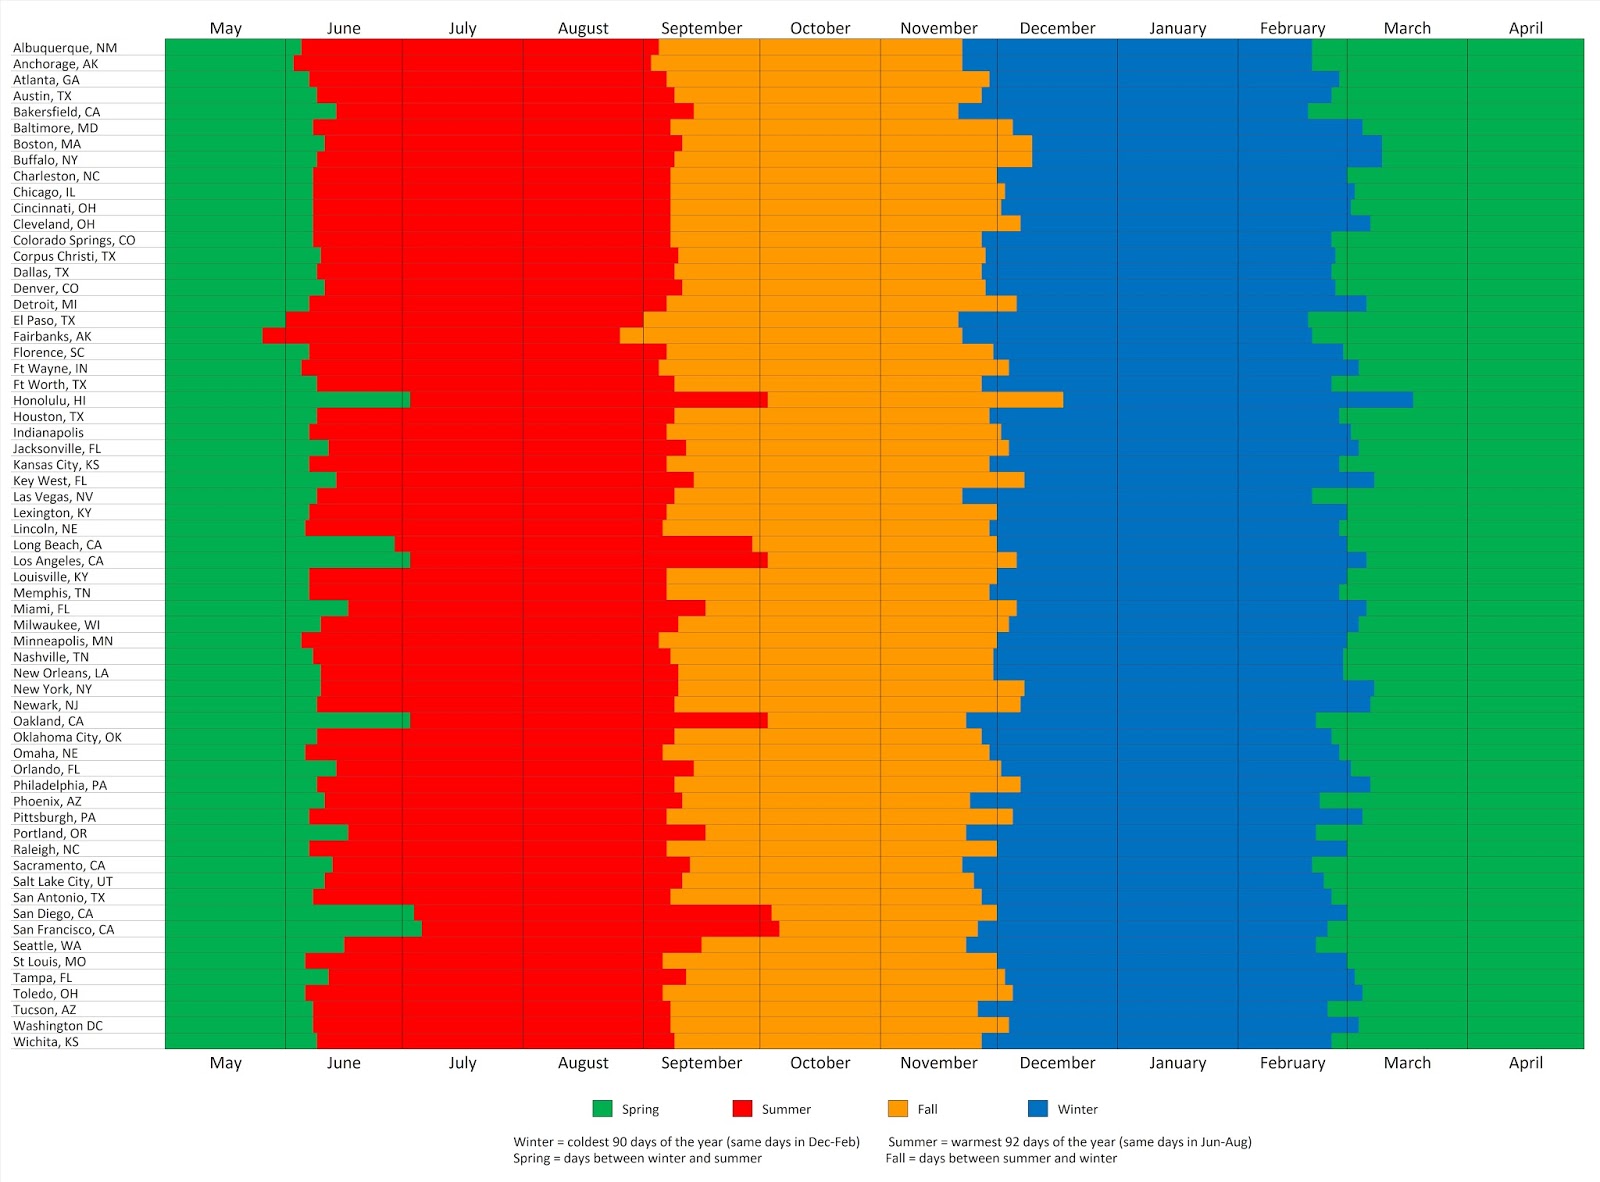
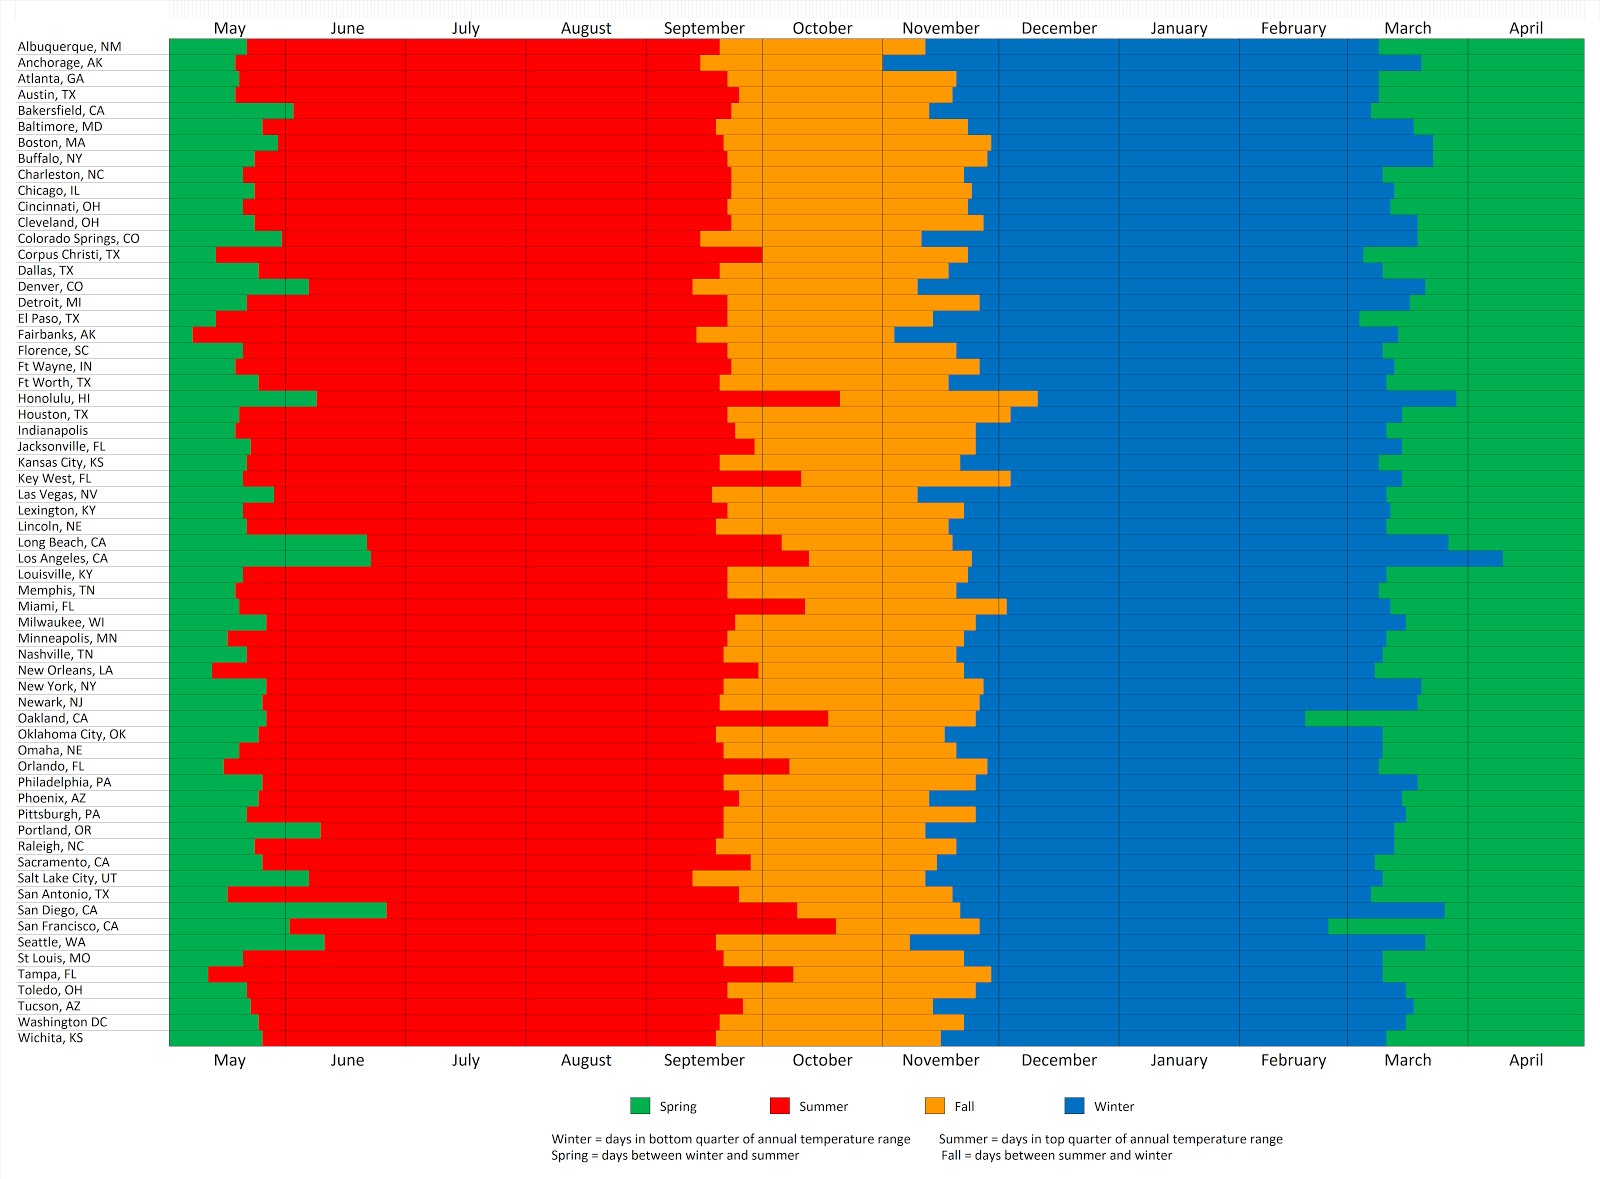
Figure 5. Graphical representation of the begin/end dates for 63 selected cities in the U.S. using the coldest 90-day period, the warmest 92-day period, and the intervening periods.
Defining Seasons Using Annual Temperature Range
This produces a much different distribution of season lengths. Most places "hover" near the warmest and coldest portions of the year for more than 90 or 92 days. For example, the annual maximum normal for Washington D.C. (Dulles) is 76.7°F. The annual minimum normal is 33.1°F. The range is therefore 43.6°F. Any days warmer than 65.8°F are considered summer and any days below 44.0°F are considered winter. The transitions between those periods is considered spring and fall. This yields a winter length of 114 days, a summer length of 119 days, a spring length of 69 days, and a fall length of 63 days. Note the dramatically longer lengths of summer and winter compared to the 90- and 92-day lengths from the previous section.
Because both the start date and the lengths of summer and winter are variable using this methodology, we cannot have a single figure (like Figures 1 & 2) that gives all the necessary information about those seasons; therefore, I just show the lengths of the four seasons in the map set below. Figures 6-9 below show the dates of winter and fall, and the lengths of spring and fall using the top/bottom temperature quartile methodology. Figure 10 shows a sample of stations with the start and end dates of all seasons using a color-coded index. It is the exact same set of stations that were shown in Figure 5 above.


No comments:
Post a Comment